1/5


StatHelp
1K+Downloads
21MBSize
7.0(03-12-2020)
DetailsReviewsInfo
1/5

Description of StatHelp
📈🔎A utility tool that includes central tendency calculations, probability distributions, and visual analyses of data with graphs.
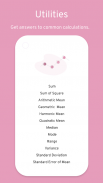
Central Tendencies and Utilities
• Sum of Values
• Sum of squared
• Arithmetic Mean
• Geometric Mean
• Harmonic Mean
• Quadratic Mean
• Median
• Mode
• Range
• Variance
• Standard Deviation
• Standard Error of Mean
Graphs
• Bar Charts
• Box Plots
• Scatter Plots
• Plots
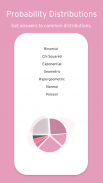
Probability Distributions
• Binomial
• Chi Squared
• Exponential
• Geometric
• Hypergeometric
• Normal
• Poisson
StatHelp - Version 7.0
(03-12-2020)What's newVersion 6.0 1. Fixing a bug where output doesn't show
StatHelp - APK Information
APK Version: 7.0Package: com.stathelp_mobileName: StatHelpSize: 21 MBDownloads: 0Version : 7.0Release Date: 2023-01-20 07:21:02Min Screen: SMALLSupported CPU:
Package ID: com.stathelp_mobileSHA1 Signature: 8A:36:72:C6:EF:01:8C:50:AD:79:6D:09:92:74:DE:B4:DA:4C:49:4EDeveloper (CN): AndroidOrganization (O): Google Inc.Local (L): Mountain ViewCountry (C): USState/City (ST): CaliforniaPackage ID: com.stathelp_mobileSHA1 Signature: 8A:36:72:C6:EF:01:8C:50:AD:79:6D:09:92:74:DE:B4:DA:4C:49:4EDeveloper (CN): AndroidOrganization (O): Google Inc.Local (L): Mountain ViewCountry (C): USState/City (ST): California


